Measure CPU time, memory, network I/O, and duration for every HTTP request hitting your pods. Track correlation IDs across services. Zero instrumentation required.
Deep per-request visibility without touching your application code
CPU time, memory RSS, duration, and network bytes measured for each individual HTTP request — not just aggregates.
Uses kernel sched_switch tracepoint for actual on-CPU nanoseconds. No estimation, no approximation.
Auto-extracts X-Correlation-ID, X-Request-ID, traceparent, and 4 more headers. Fully configurable.
eBPF attaches to kernel TCP functions. No SDK, no sidecar, no agent library. Works with any language.
Bounded-cardinality aggregate metrics for alerting and long-term trending. Plus per-request gauges for detail view.
Pre-built 8-panel dashboard with request table, time-series charts, and filtering by namespace/pod/correlation ID.
Single-command deployment. Bundled Prometheus + Grafana, or integrate with your existing monitoring stack.
In-memory ring buffer for speed, optional SQLite for persistence, optional Remote Write to VictoriaMetrics.
Captures outbound TCP connections made during request processing. Maps destination IPs to K8s service names.
Real-time Grafana dashboard with per-request visibility
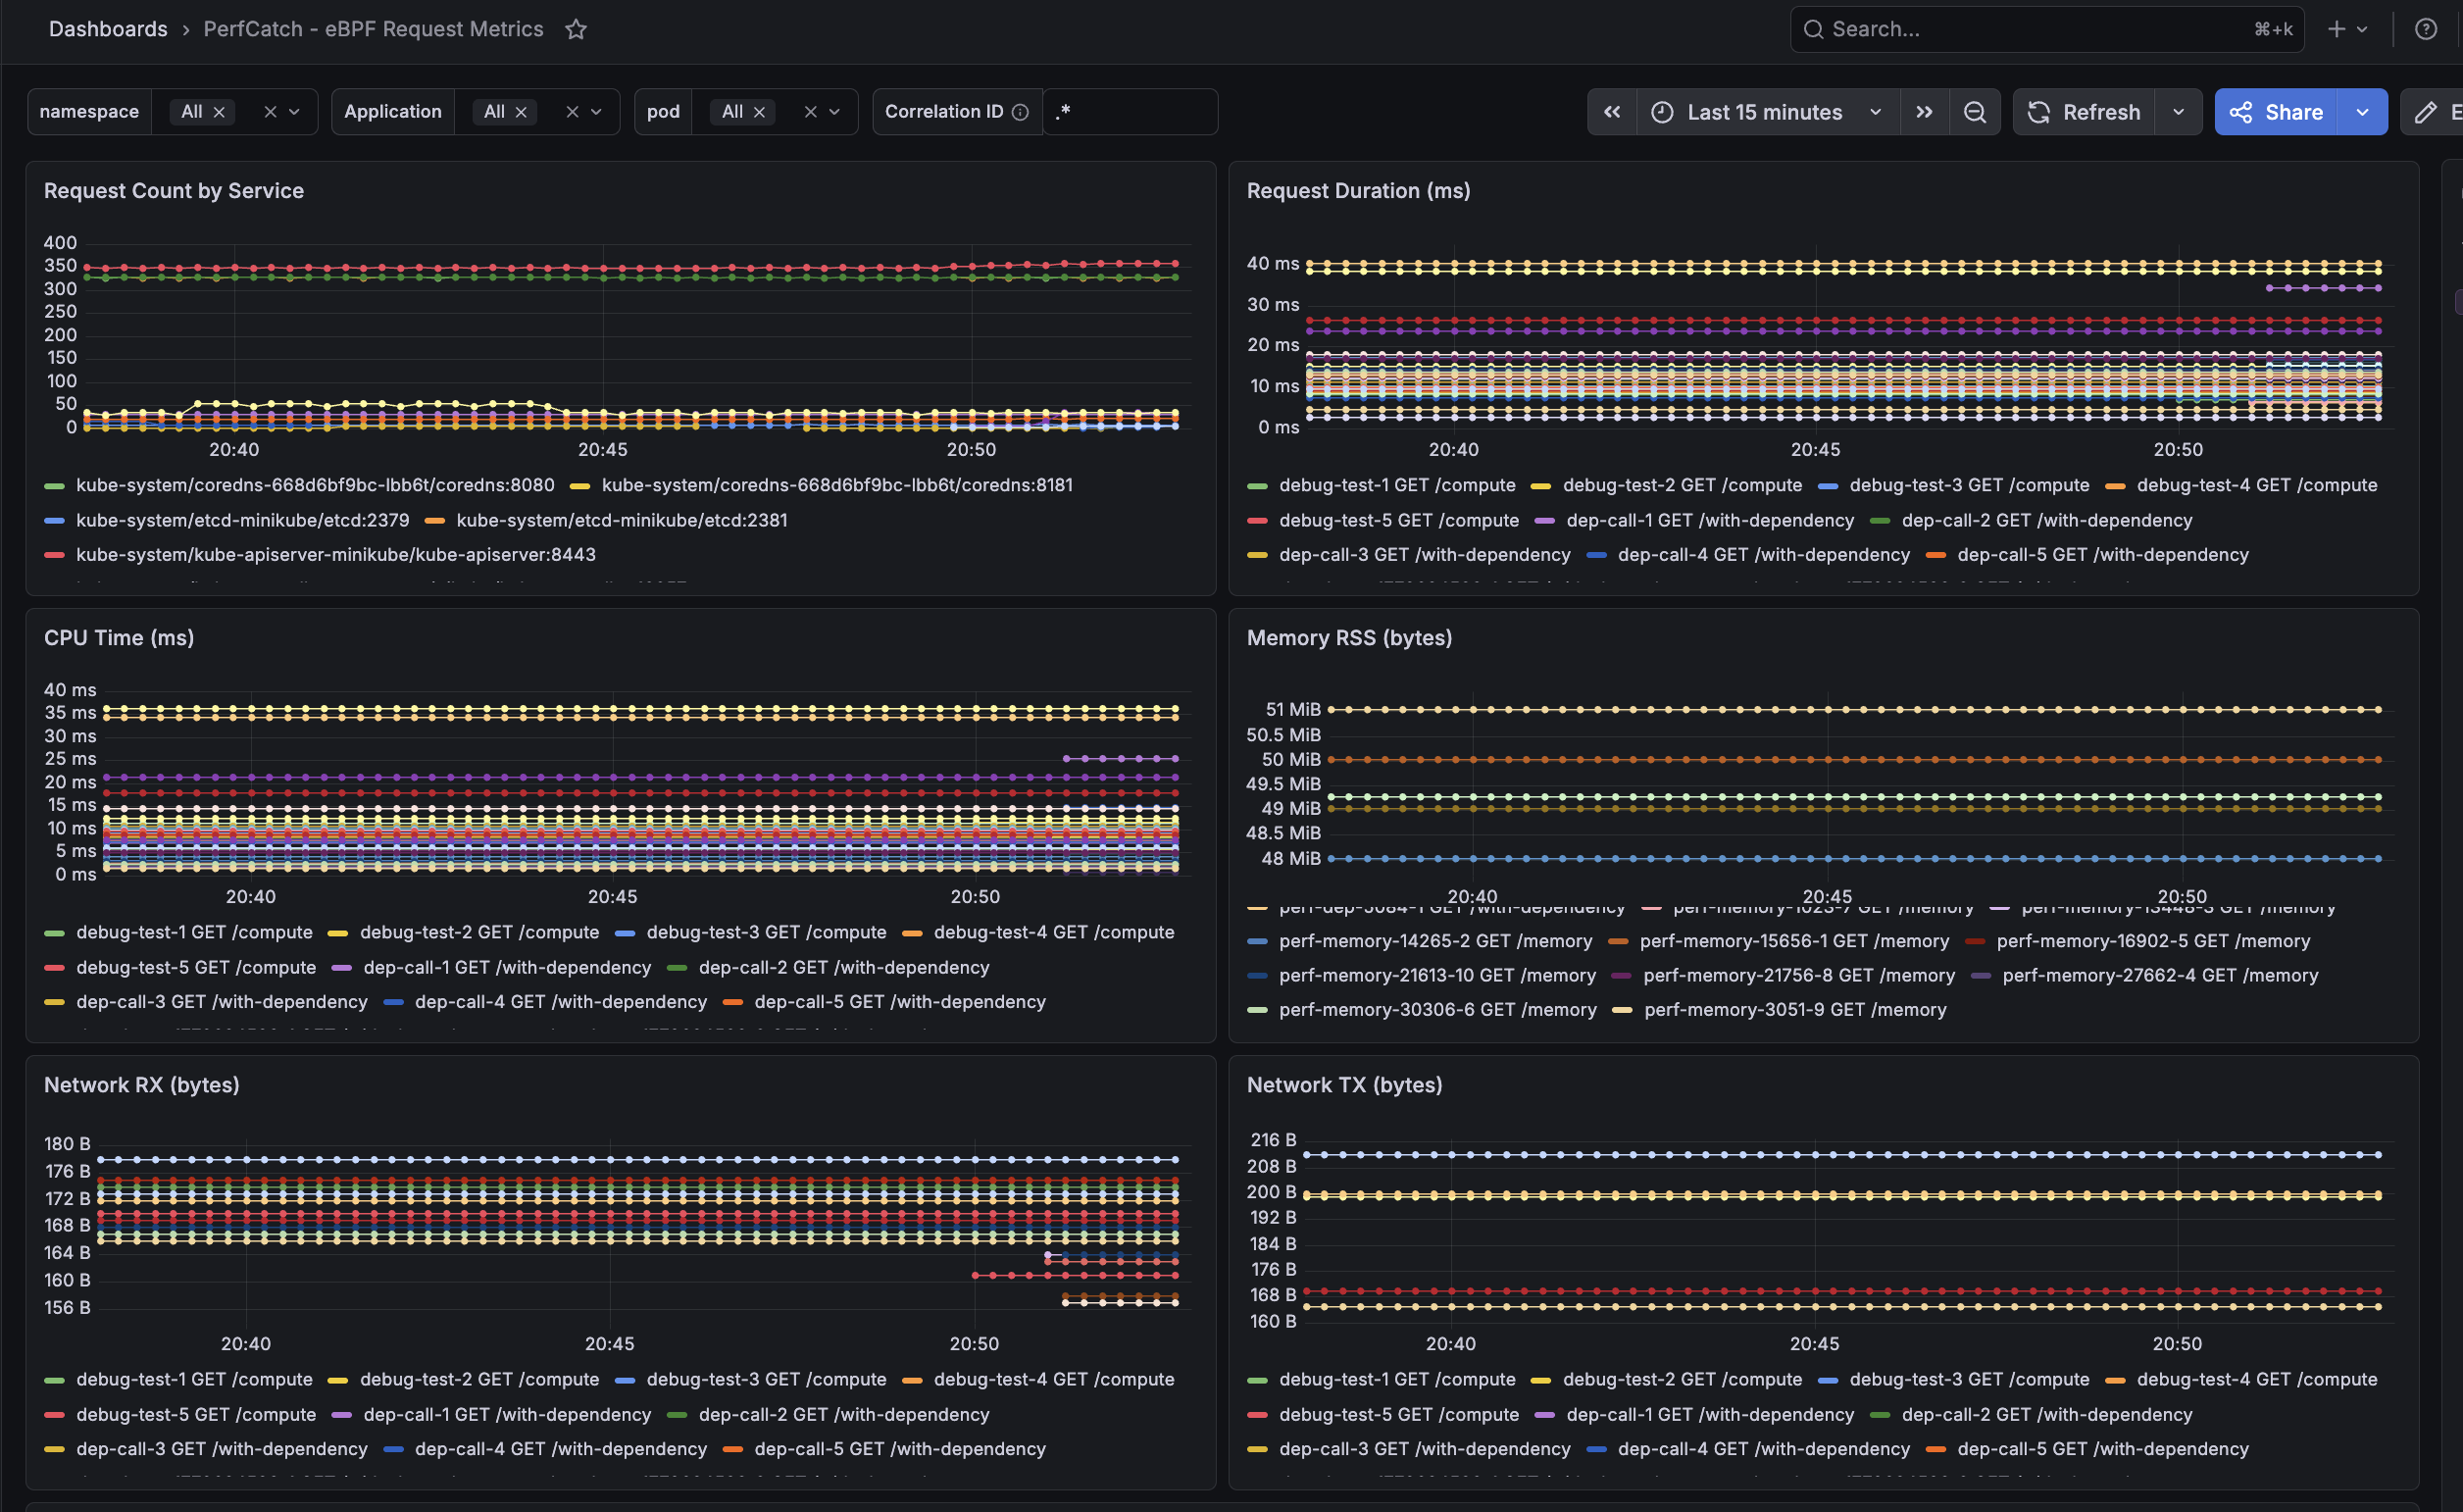
6 panels showing Request Count by Service, Request Duration (ms), CPU Time (ms), Memory RSS (bytes), Network RX and TX bytes — all with per-pod granularity and correlation ID filtering.
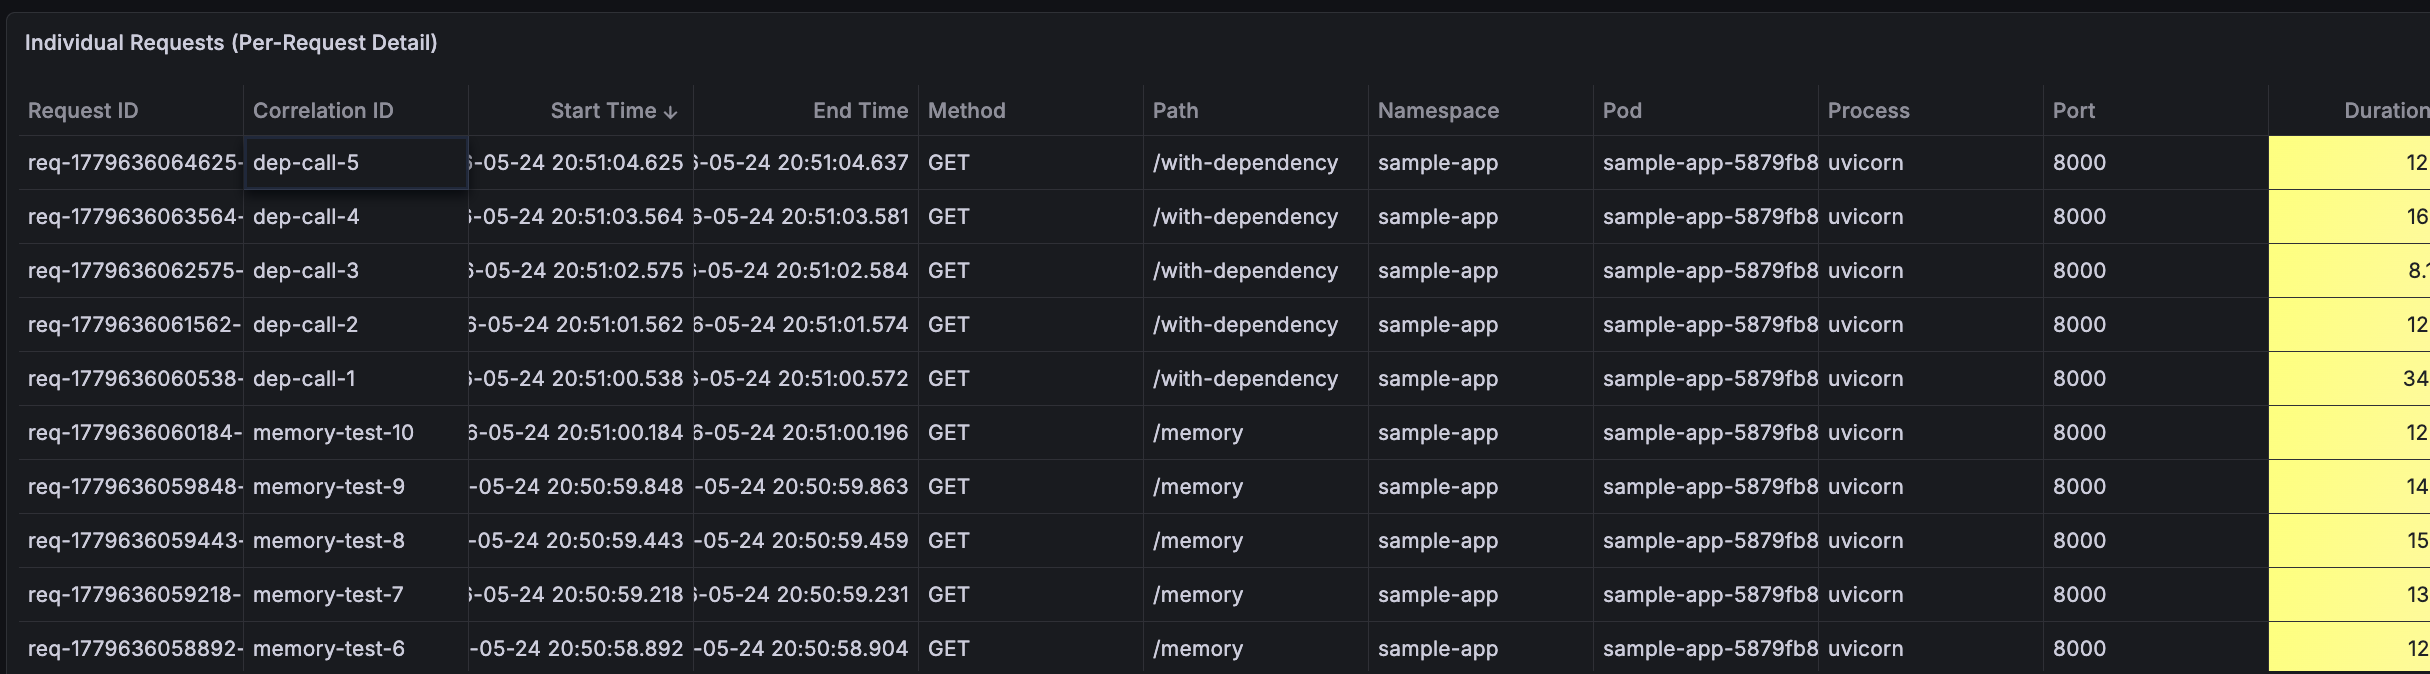
Every individual request with Request ID, Correlation ID, Start/End Time, HTTP Method, Path, Namespace, Pod, and Process info.
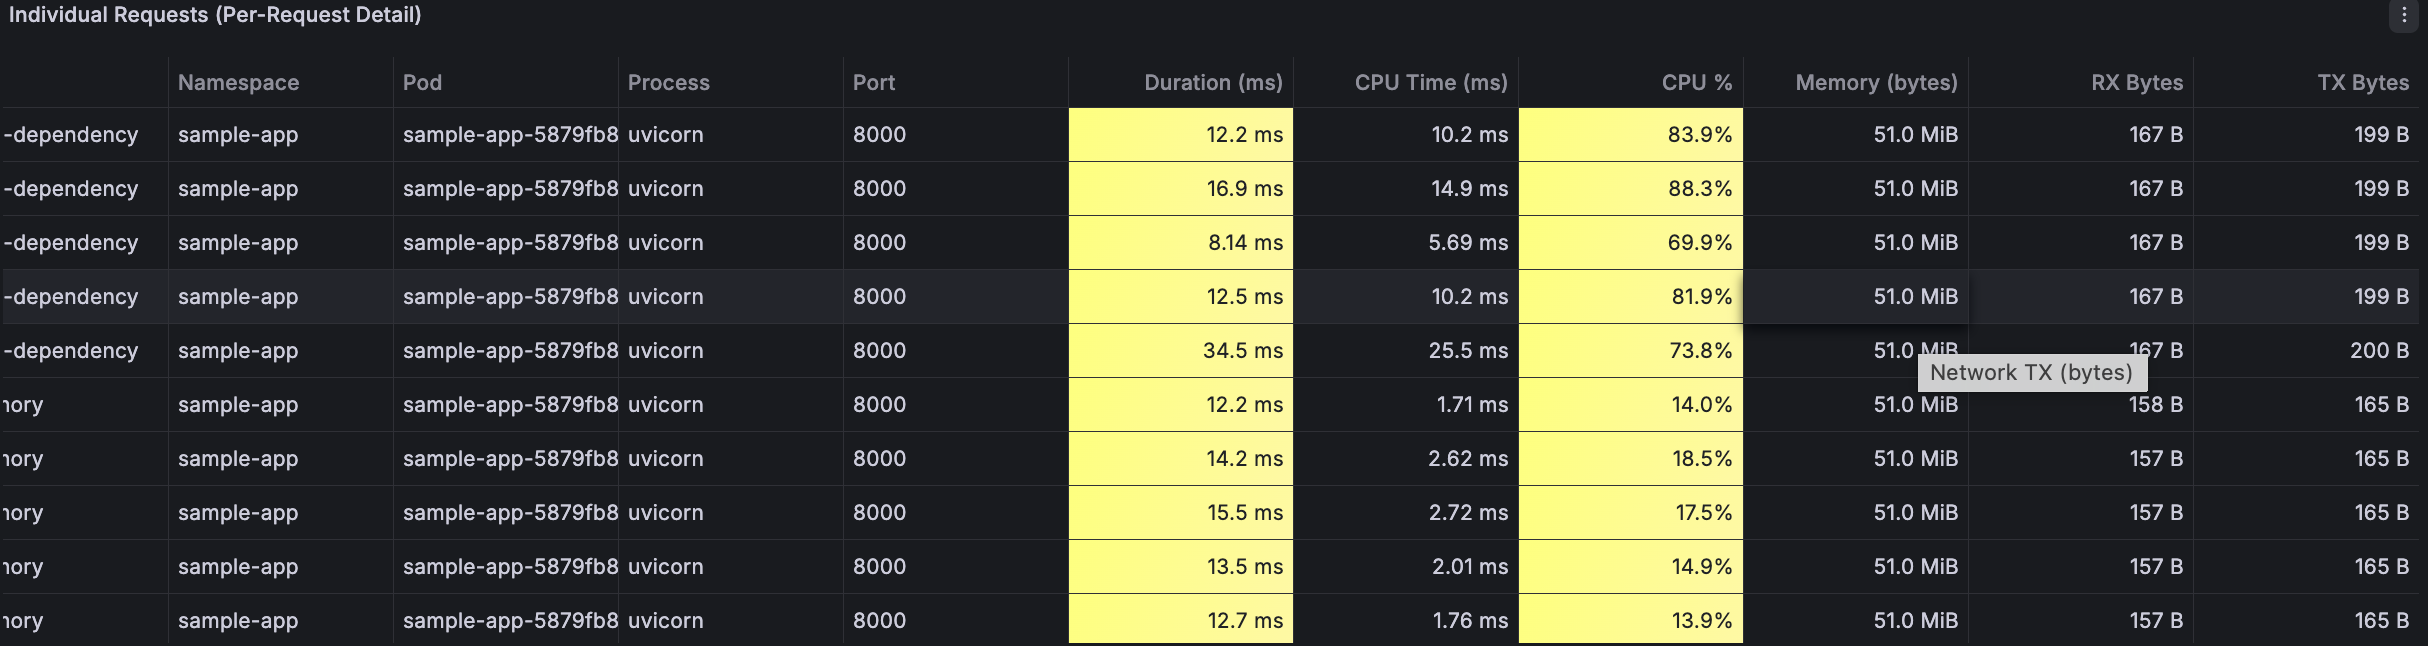
Duration (ms), CPU Time (ms), CPU % utilization, Memory (bytes), Network RX and TX bytes — color-coded for quick anomaly detection.
eBPF programs in kernel space, zero-copy event processing in userspace
Scrape /metrics every 15s
5Gi PVC • 15d retention
VictoriaMetrics / Mimir / Thanos
Long-term per-request storage
Pre-built 8-panel dashboard
Real-time request table
Deep visibility into every request's resource consumption
| Metric | Source | Description |
|---|---|---|
duration_ms |
accept() → tcp_close() | Total request wall-clock time |
cpu_time_ms |
sched_switch tracepoint | Actual on-CPU execution time (not wall-clock) |
memory_rss_bytes |
/proc/<pid>/status | Process RSS memory at request time |
bytes_received |
tcp_recvmsg kprobe | Network bytes received per request |
bytes_sent |
tcp_sendmsg kprobe | Network bytes sent per request |
correlation_id |
HTTP header capture (eBPF) | Extracted from X-Correlation-ID, traceparent, etc. |
http_method / path |
TCP stream first bytes | GET /compute extracted from request line |
Choose the setup that fits your infrastructure
Agent + Prometheus (5Gi PVC, 15d retention) + Grafana with pre-built dashboard
helm install perfcatch charts/perfcatch \ -n perfcatch --create-namespace
Full stack + long-term per-request storage via Remote Write (30d retention)
helm install perfcatch charts/perfcatch \ -n perfcatch --create-namespace \ --set monitoring.victoriametrics.enabled=true
Agent only — auto-discovered via pod annotations. No bundled monitoring.
helm install perfcatch charts/perfcatch \ -n perfcatch --create-namespace \ --set monitoring.enabled=false
No Prometheus. SQLite persistence on hostPath. Query via /api/requests.
helm install perfcatch charts/perfcatch \ -n perfcatch --create-namespace \ --set monitoring.enabled=false \ --set prometheusAnnotations.enabled=false
Layered design optimized for high throughput with flexible durability
In-memory deque
50K entries
Zero I/O
Histograms + gauges
5Gi PVC
15d retention
VictoriaMetrics
10Gi PVC
30d retention
hostPath volume
Per-node disk
Unlimited
Up and running in under 2 minutes
Install PerfCatch with the bundled monitoring stack
helm install perfcatch charts/perfcatch \
-n perfcatch --create-namespace \
--set config.namespace=my-app
Check the DaemonSet pod is healthy on your node
kubectl -n perfcatch get pods
Add any supported header — it's auto-captured by eBPF
curl -H "X-Correlation-ID: order-12345" \
http://my-app/compute
Pre-built dashboard with 8 panels — request table, time-series, and filters
kubectl -n monitoring port-forward svc/grafana 3000:3000
Get per-request data as JSON — filter by correlation ID, namespace, or pod
curl localhost:9090/api/requests?correlation_id=order-12345
Auto-detected from HTTP requests. Add your own with a single config.
x-correlation-id
x-request-id
x-trace-id
traceparent
x-amzn-trace-id
request-id
correlation-id
+ your custom